Usage and Features
Layers
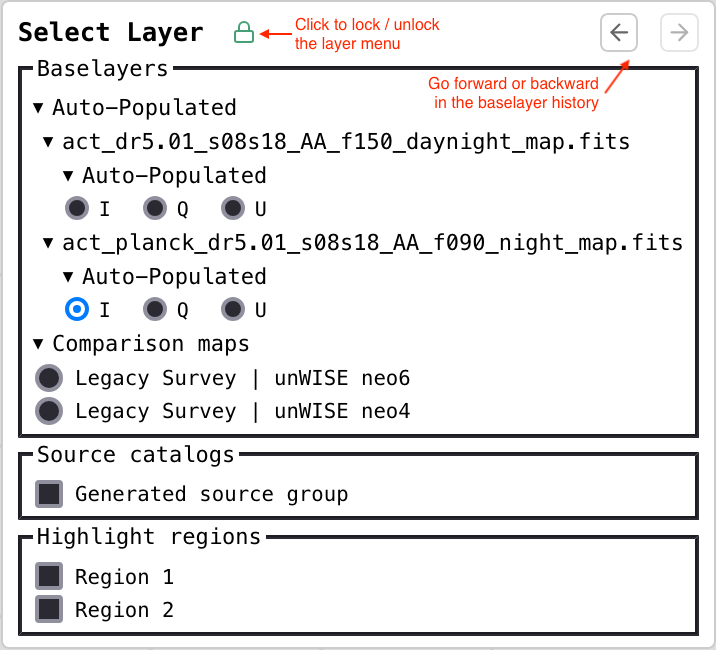
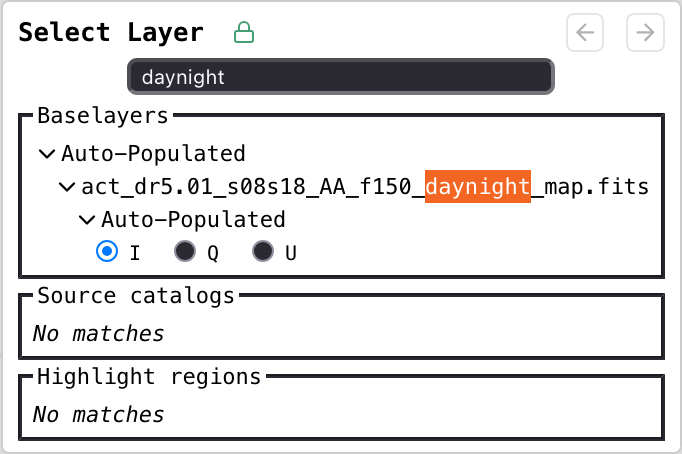
To access the layer menu, mouse over the layer menu icon (
![]() ) in the top right. The layer menu can be locked by clicking the lock icon in the layer menu’s header. The screenshot below shows a locked layer menu with some annotations describing a few of its less obvious features.
) in the top right. The layer menu can be locked by clicking the lock icon in the layer menu’s header. The screenshot below shows a locked layer menu with some annotations describing a few of its less obvious features.
Projection and Orientation
The default map projection is EPSG:4326. Currently, the projection cannot be changed but there are plans for this to be configurable. The external baselayers from Legacy Survey are reprojected by OpenLayers from EPSG:3857 to EPSG:4326.
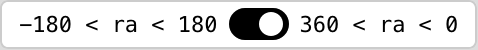
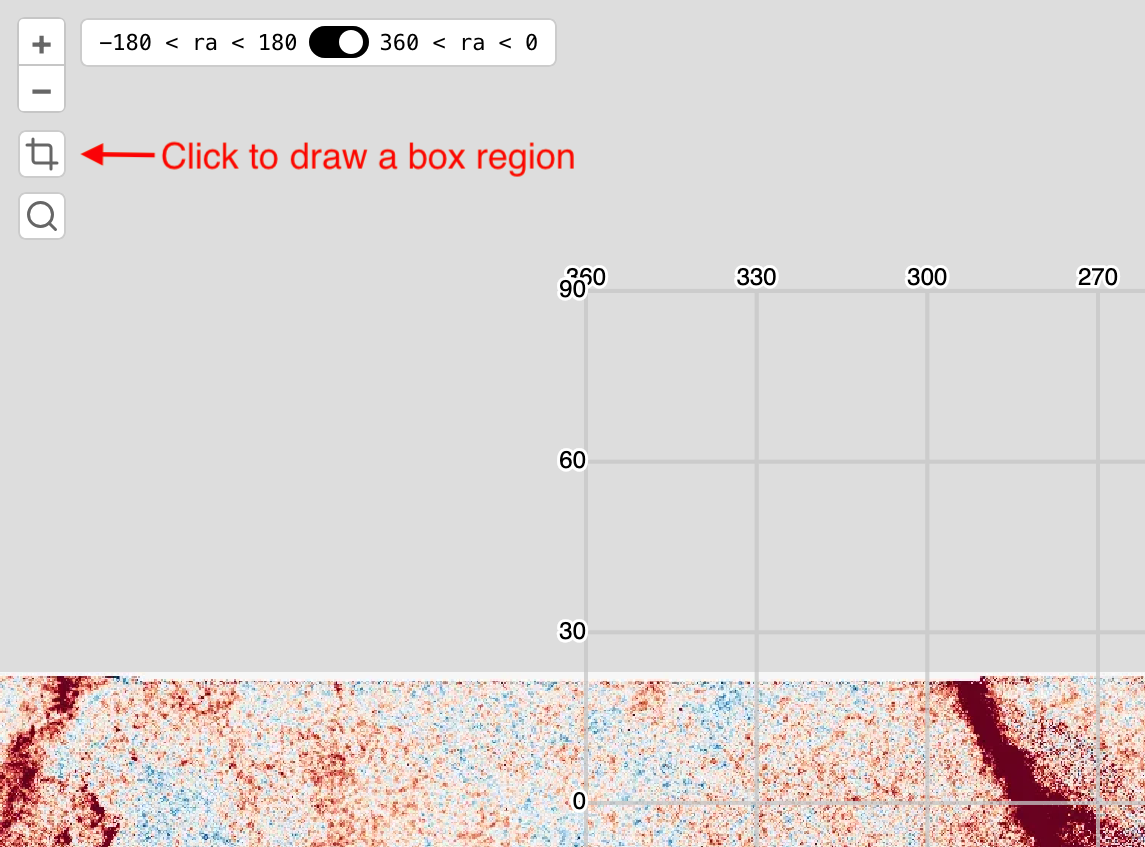
The orientation of the layers is defaulted to 360 < ra < 0 to allow seamless comparisons between the Simons Observatory maps and the included comparison maps. However, the toggle switch at the top left (
 ) can orient the layers to
 -180 < ra < 180 when preferred. Note that the comparison maps are disabled when the map is oriented to -180 < ra < 180.
Baselayers
These are maps that are served from your tile server or, in the case of the Comparison maps section, from an external tile server.
Baselayer history is tracked similarly to how web browsers track history. The left and right arrows in the layer menu’s header (see image above) can be used to switch baselayers according to the history stack. Alternatively, one can use the keyboard to enter H to go back and L to go forward.
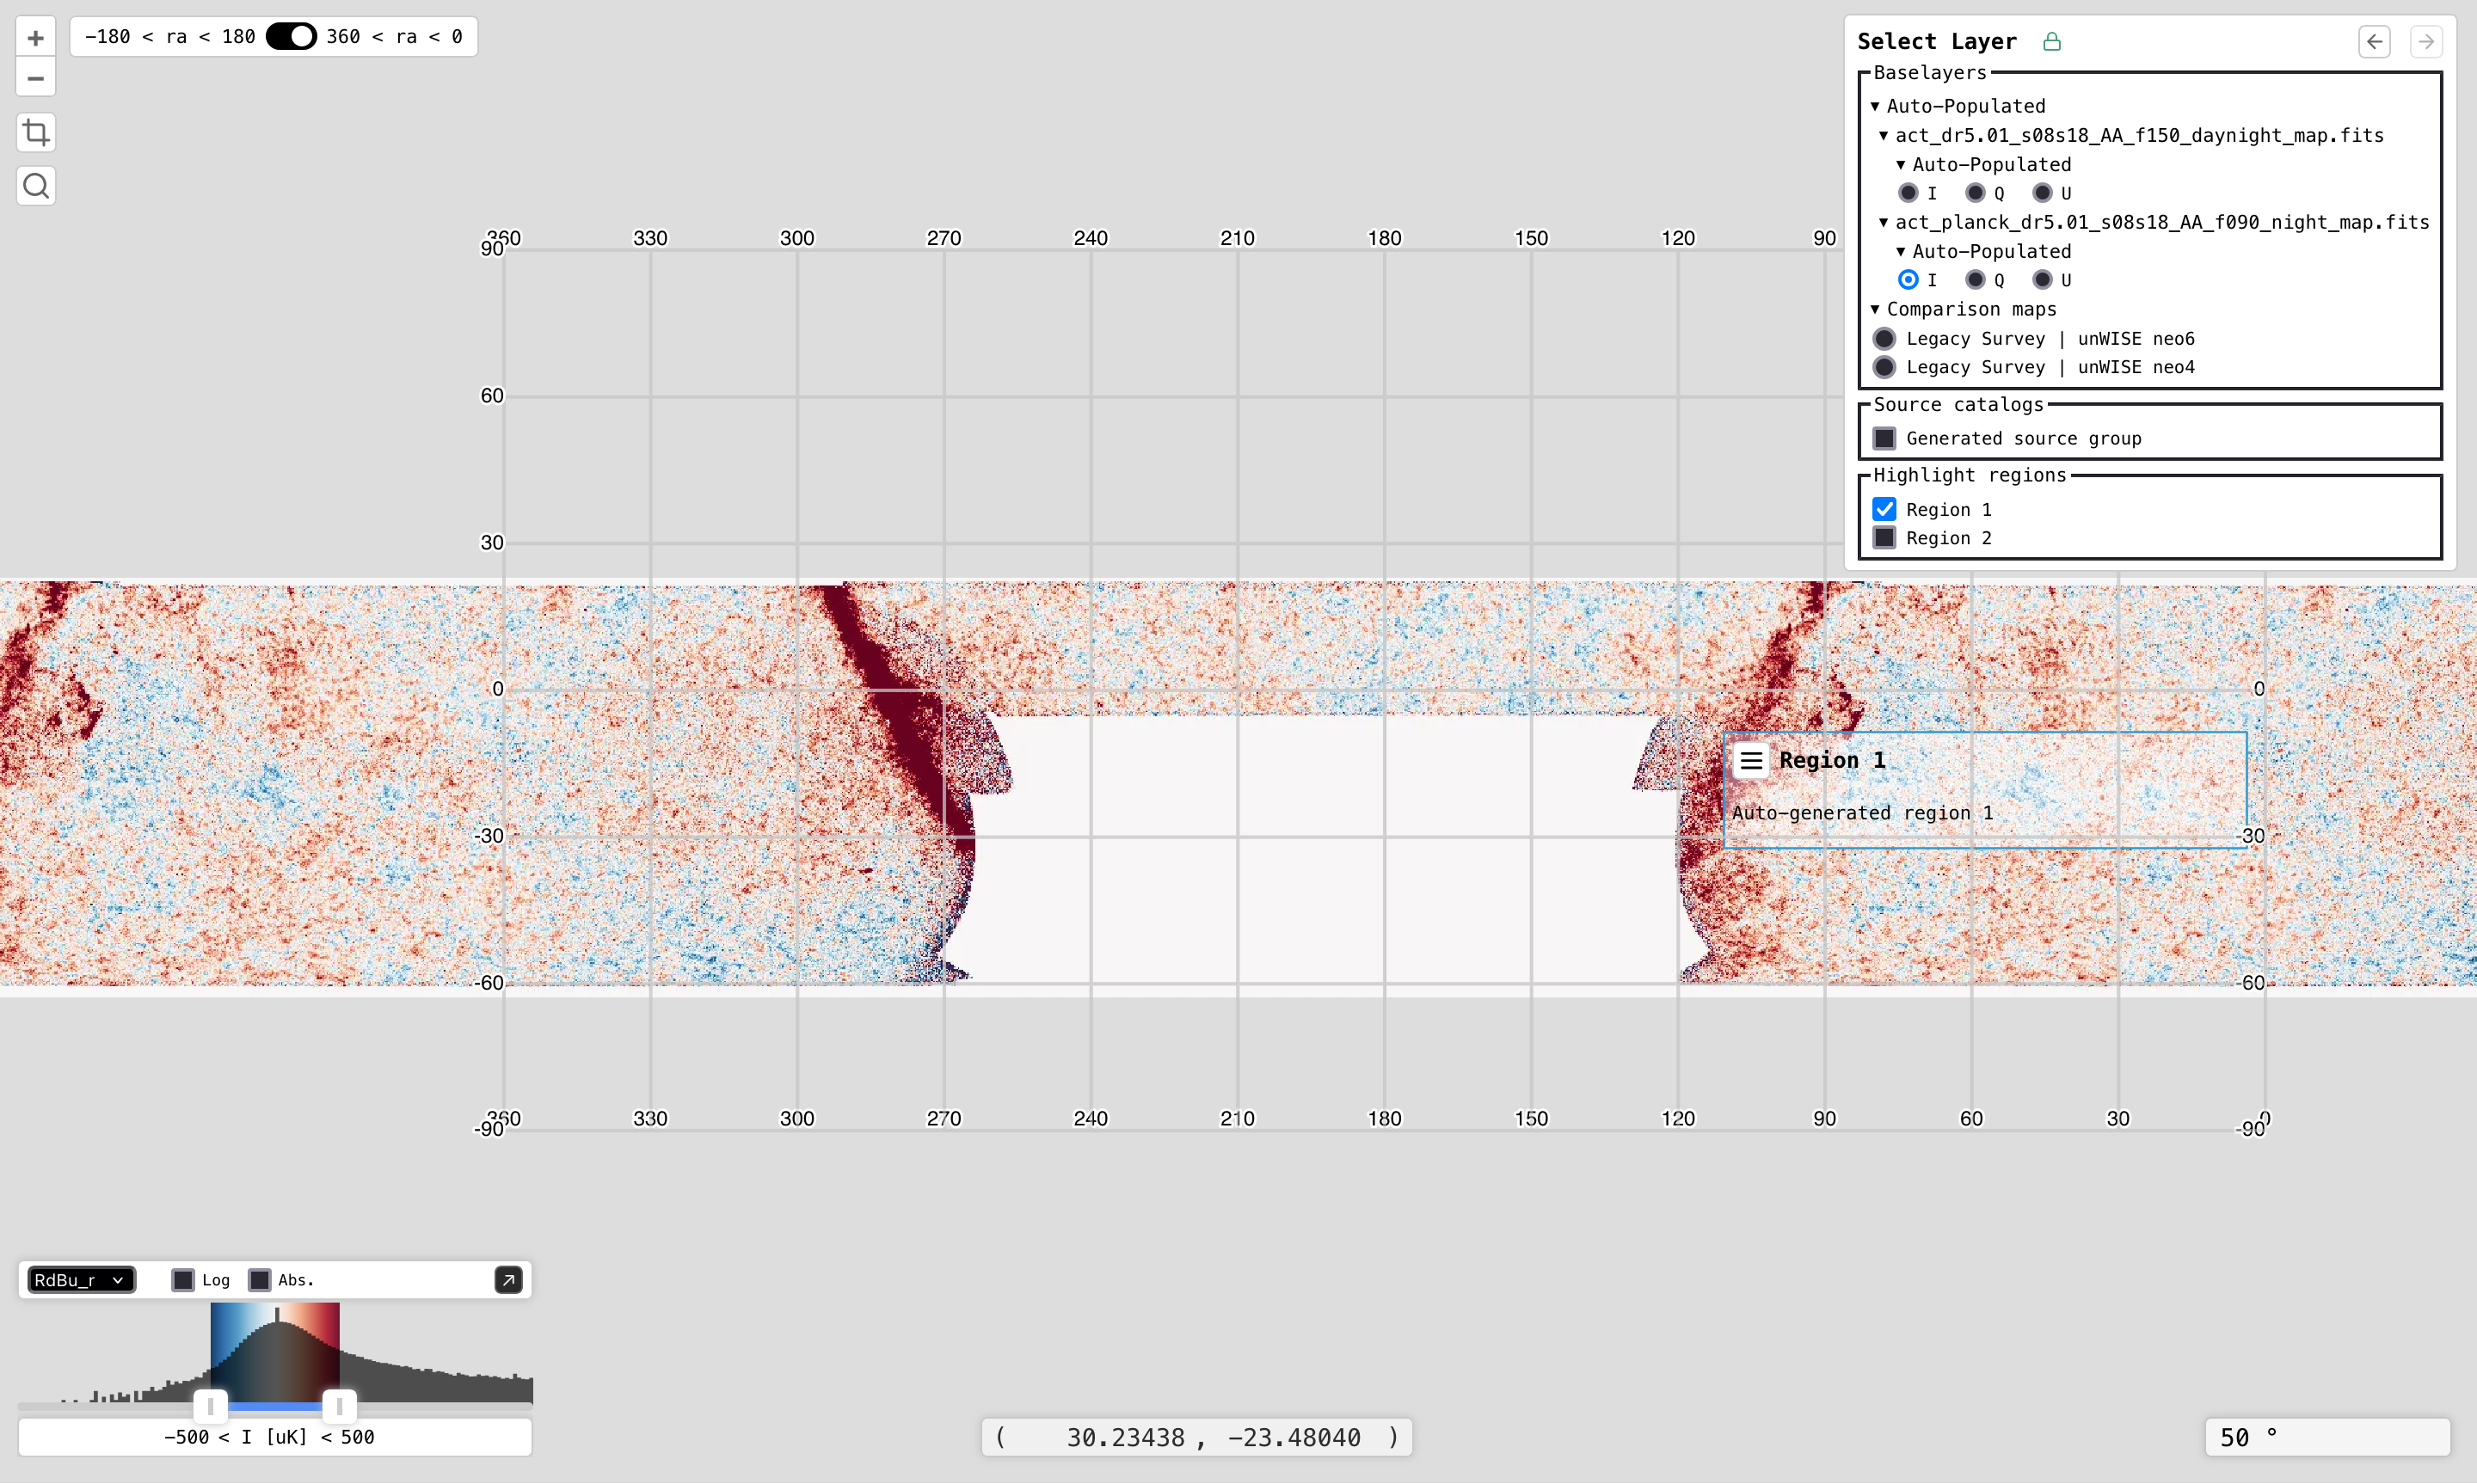
Highlight Regions
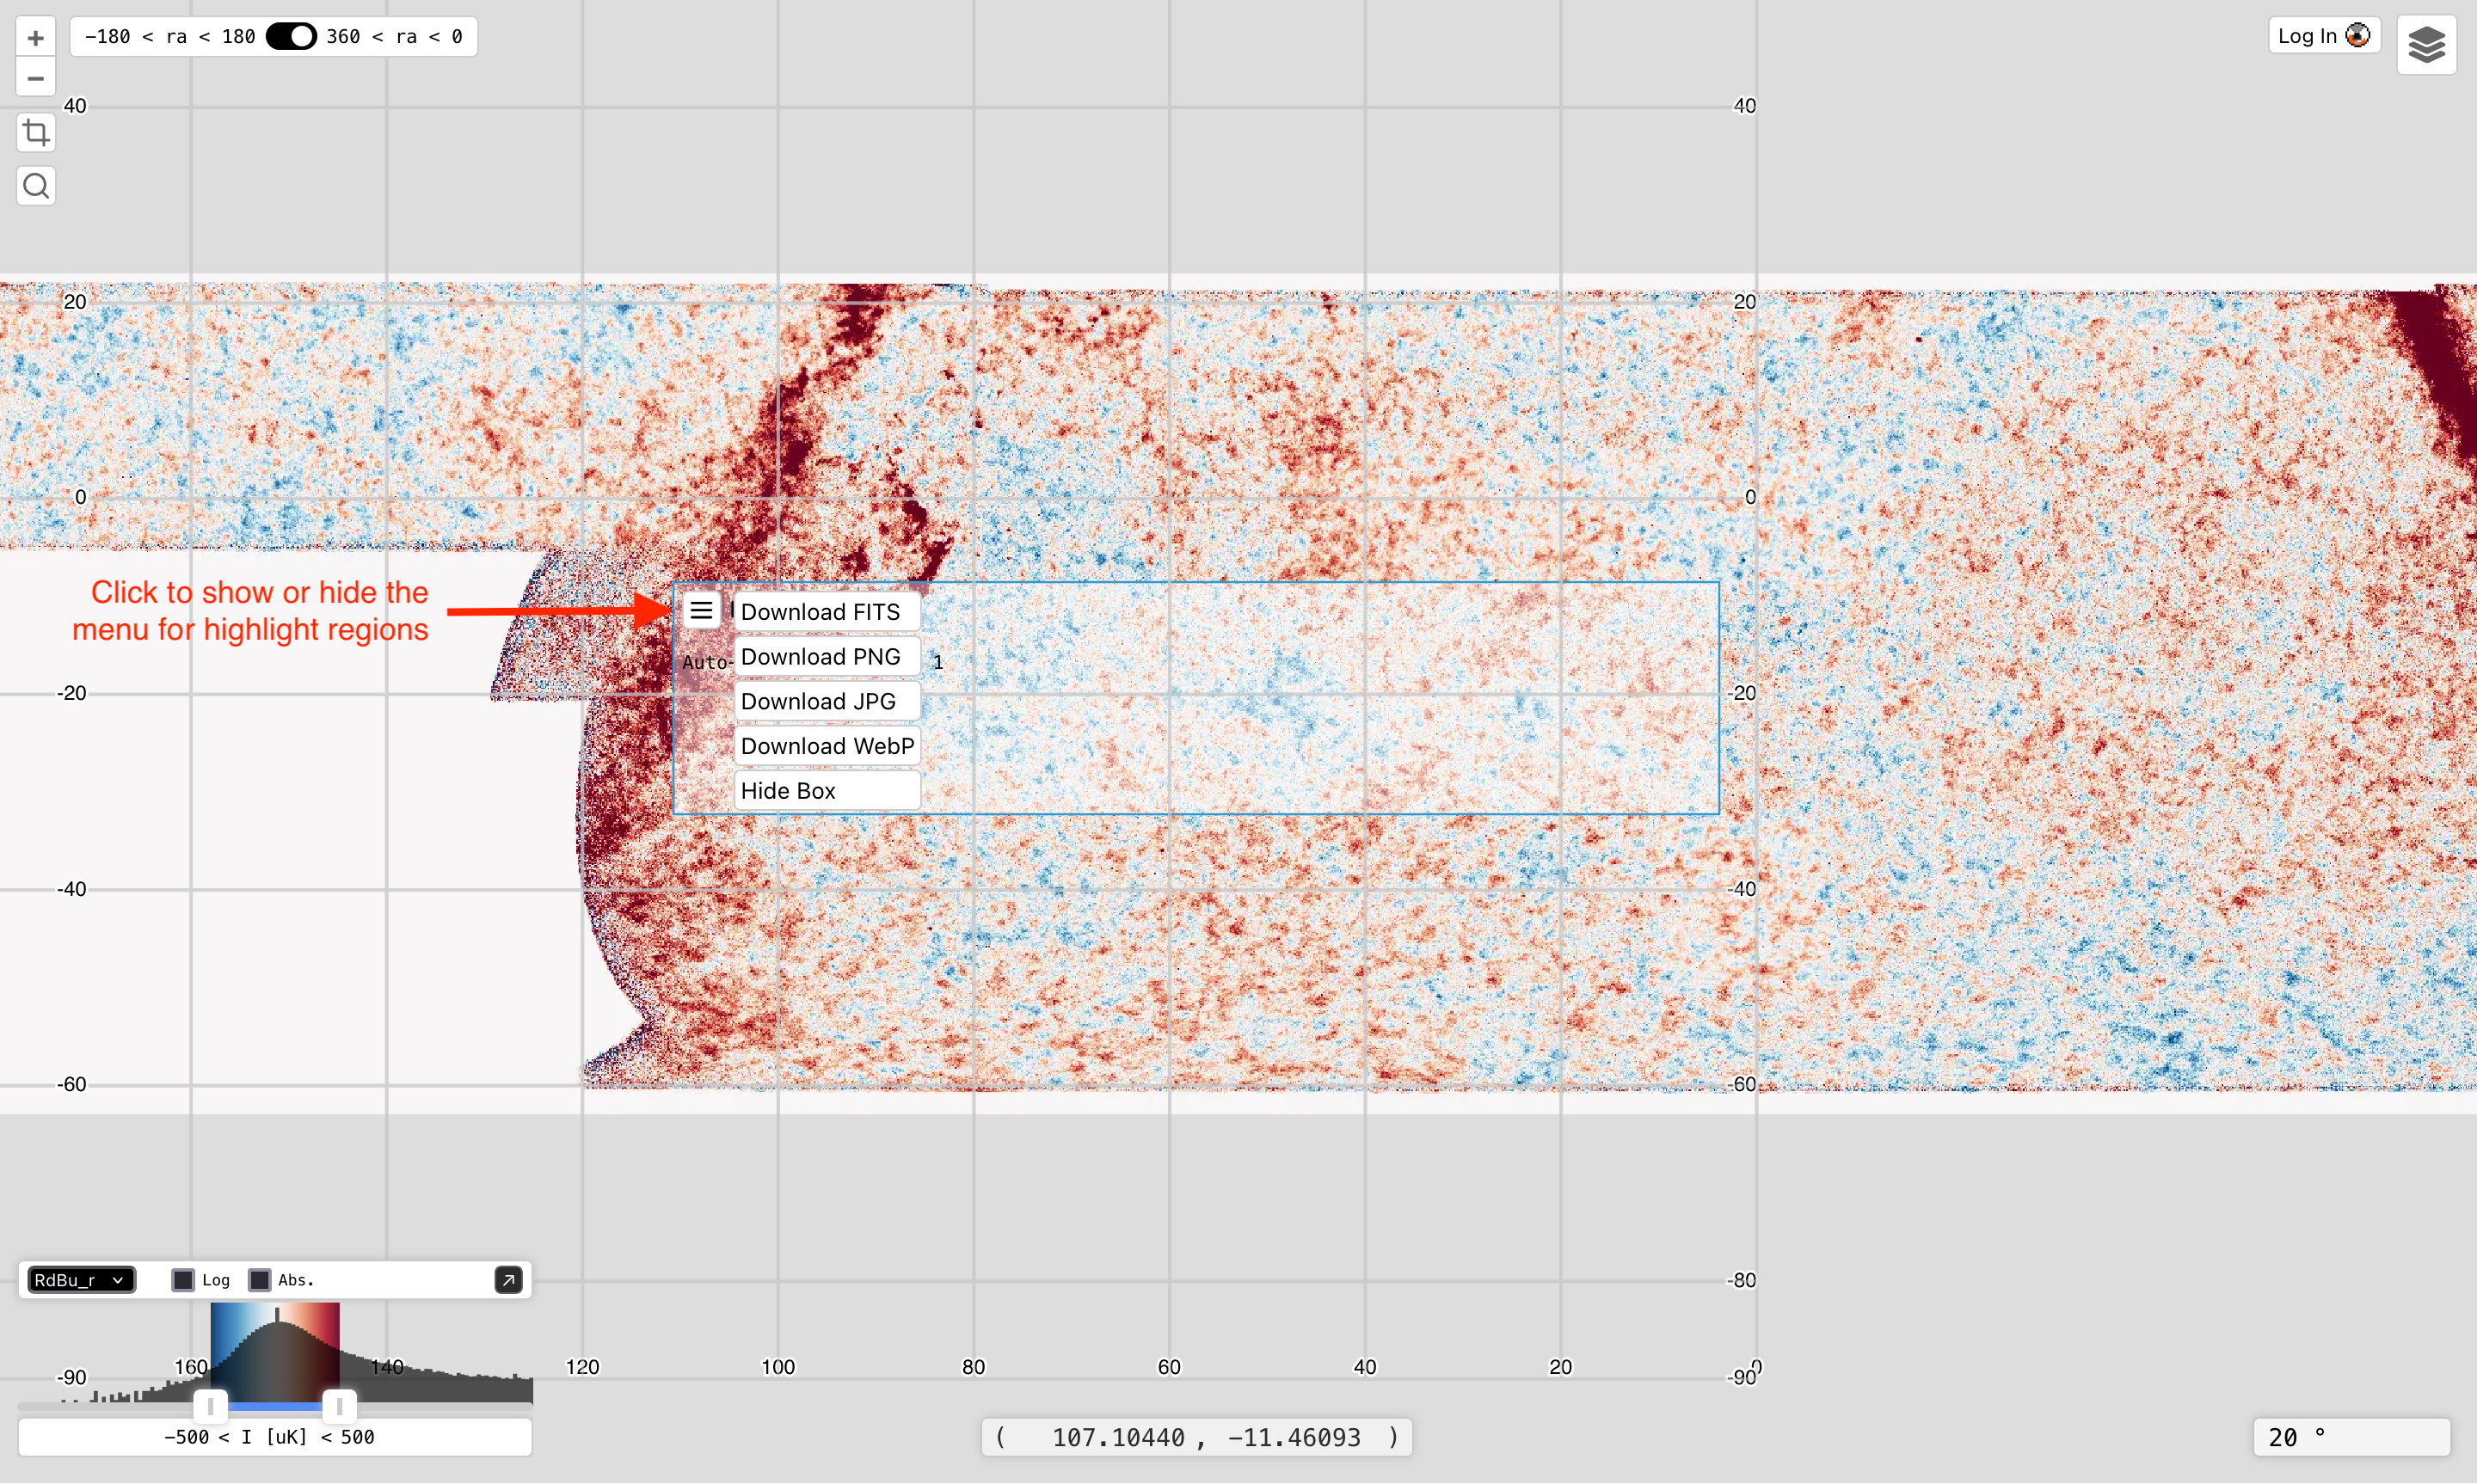
When applicable, a section will be rendered in the layer menu for highlight regions. These regions can be toggled on/off via checkboxes. The regions are rendered as simple rectangular overlays. When hovered over, information will be displayed and a user can open a menu in order to download a cutout of the active baselayer within the region’s boundary.
The screenshot below shows an example of a displayed highlight region named Region 1 when the region is hovered over.
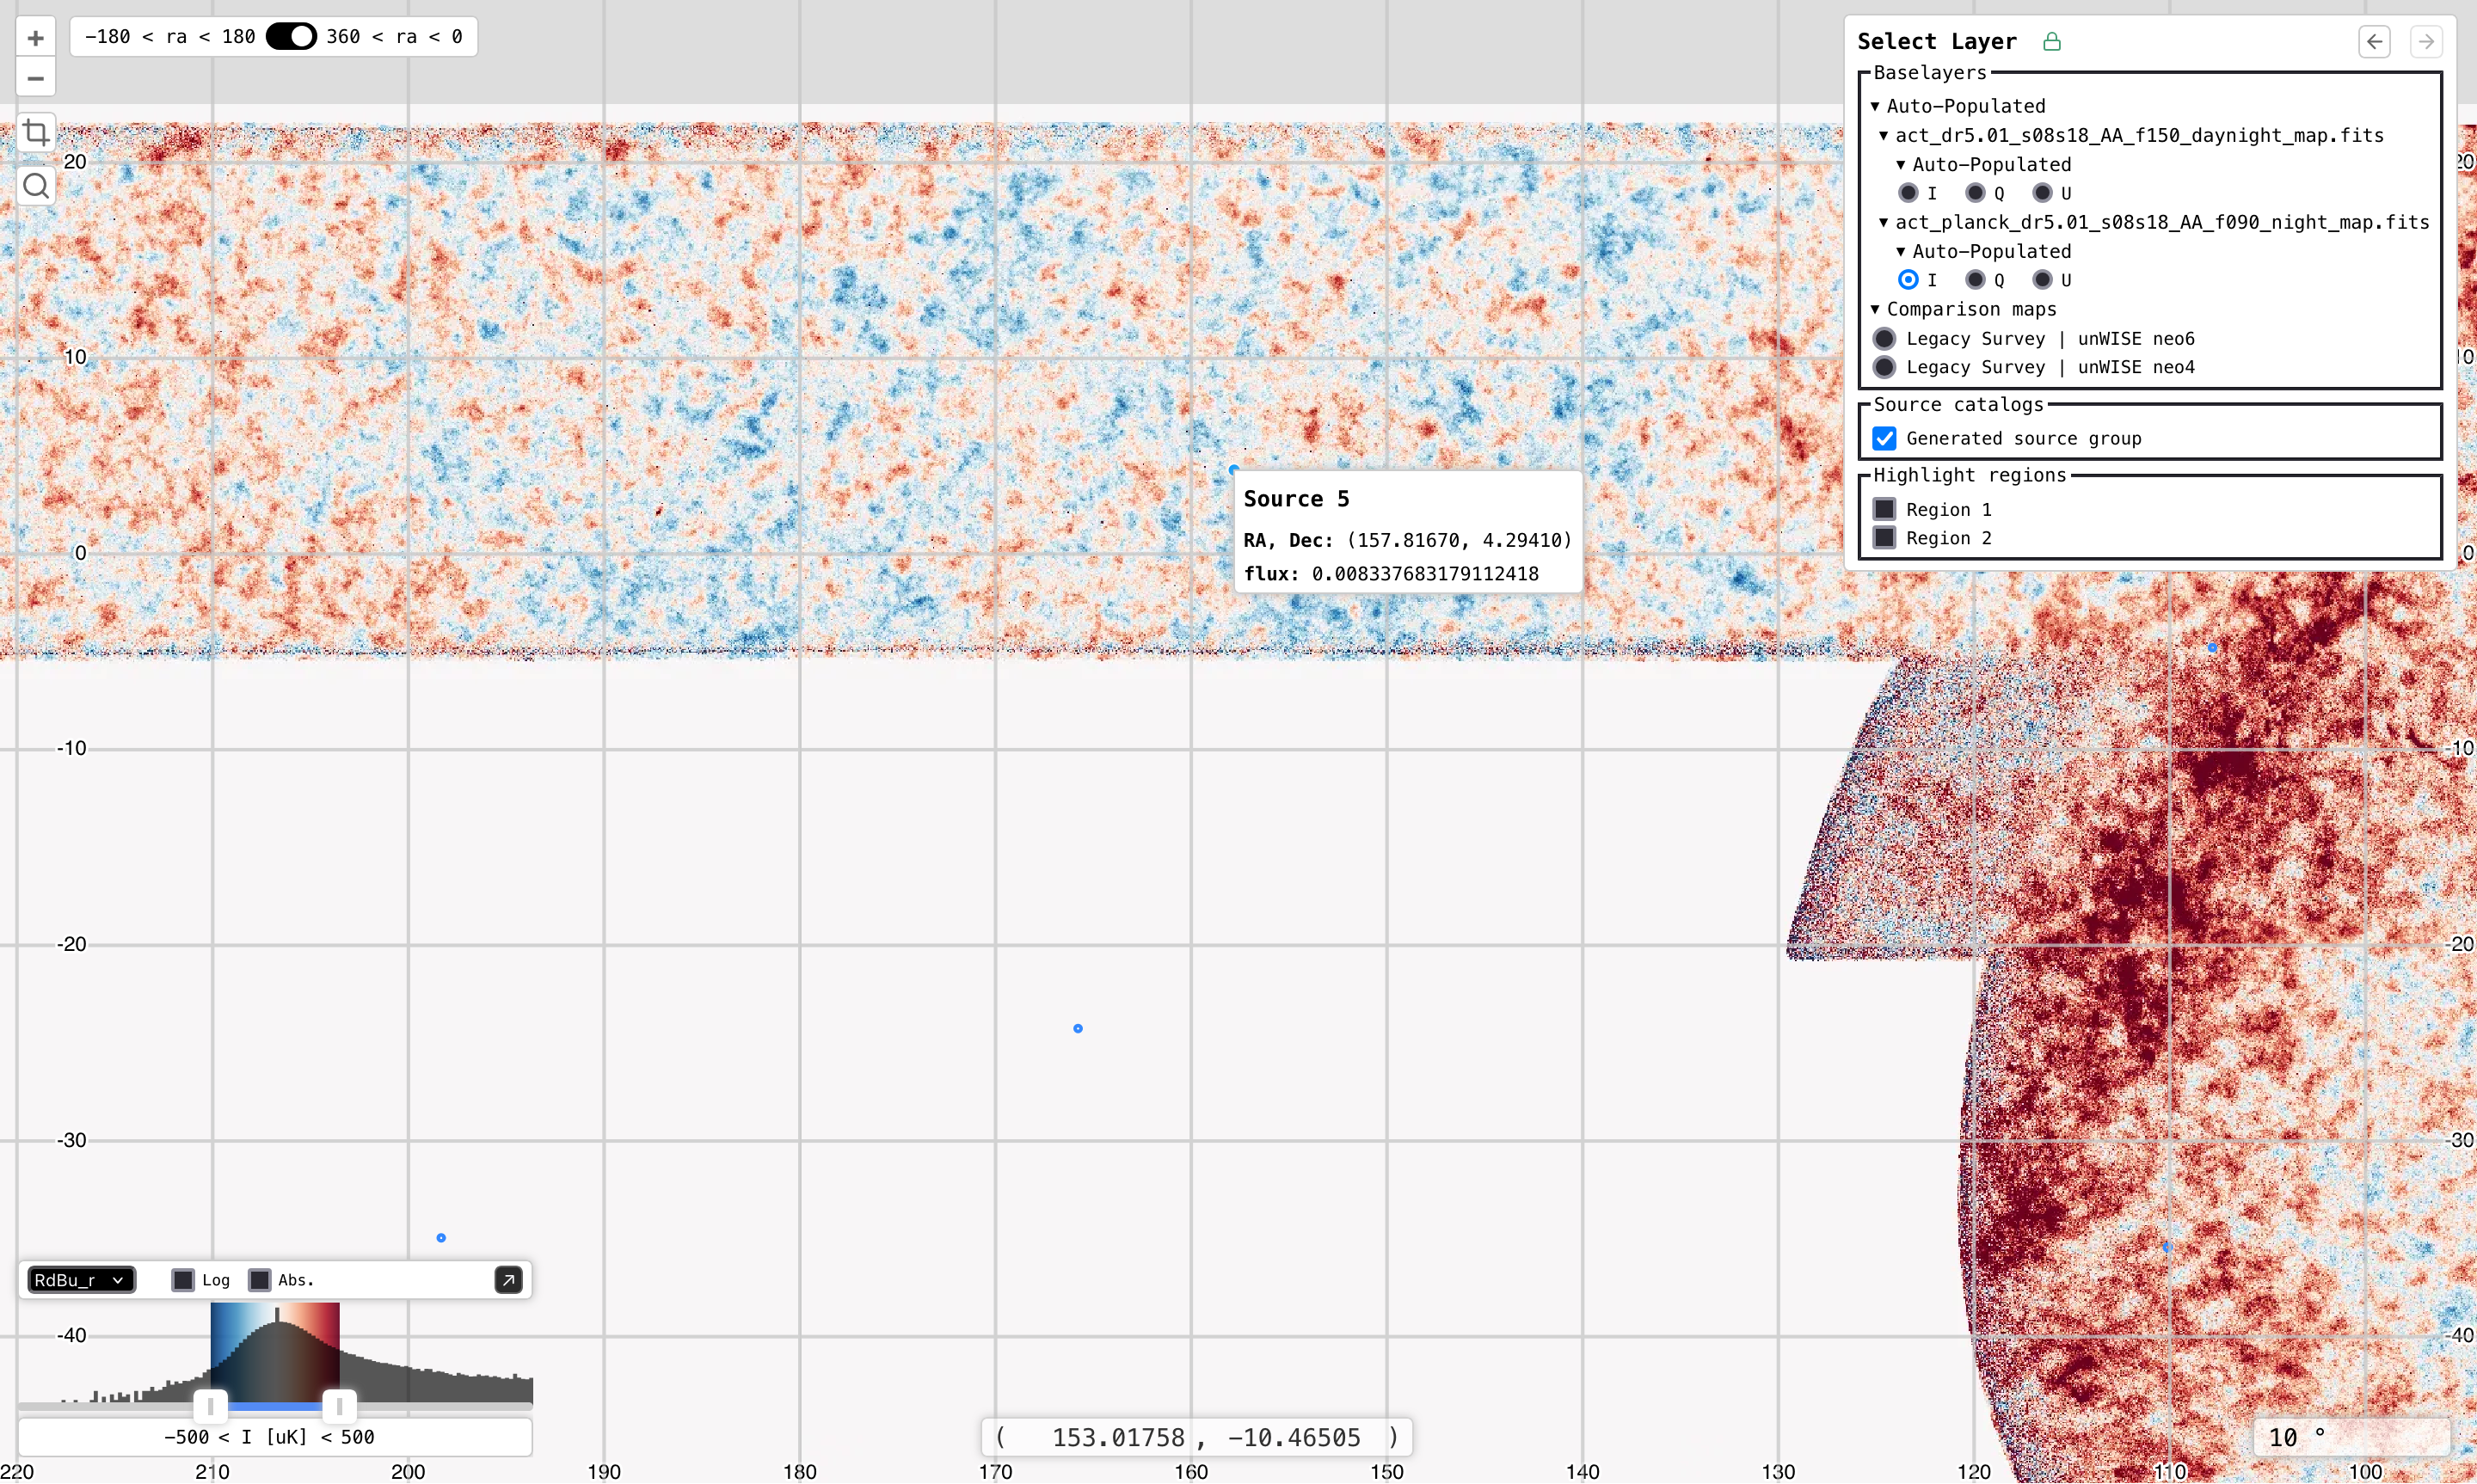
Source Catalogs
When applicable, a section will be rendered in the layer menu for source catalogs. These catalogs can be toggled on/off via checkboxes. Each source in a catalog is rendered as a marker that can be clicked on to reveal its data.
The screenshot below shows the data displayed when a source’s marker is clicked.
Filtering
Enter a search term into the search bar, then press Enter. Note that the filter will be applied to the Baselayers, Source catalogs, and Highlight regions.
When the search input is active, pressing Esc will clear the input and return the layer menu to its original, unfiltered state.
Navigation
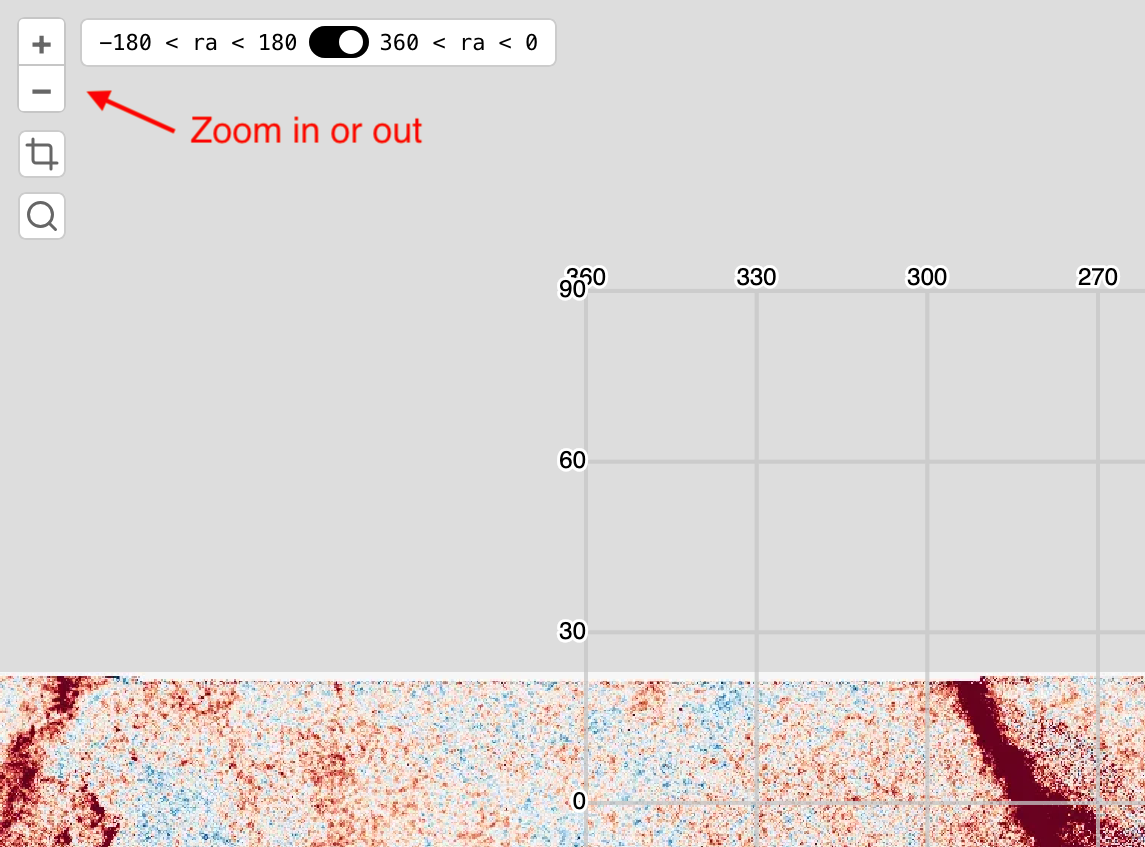
Zoom In/Out
The following options exist:
Use the mousewheel to zoom in or out.
Double-Click the map to zoom in or Shift+Double-Click to zoom out.
Use the
+and-buttons in the top left (see screenshot below).
Panning
Simply click and drag the map to pan around.
“Go To Feature” Button
Click the magnifying glass button in the top left.
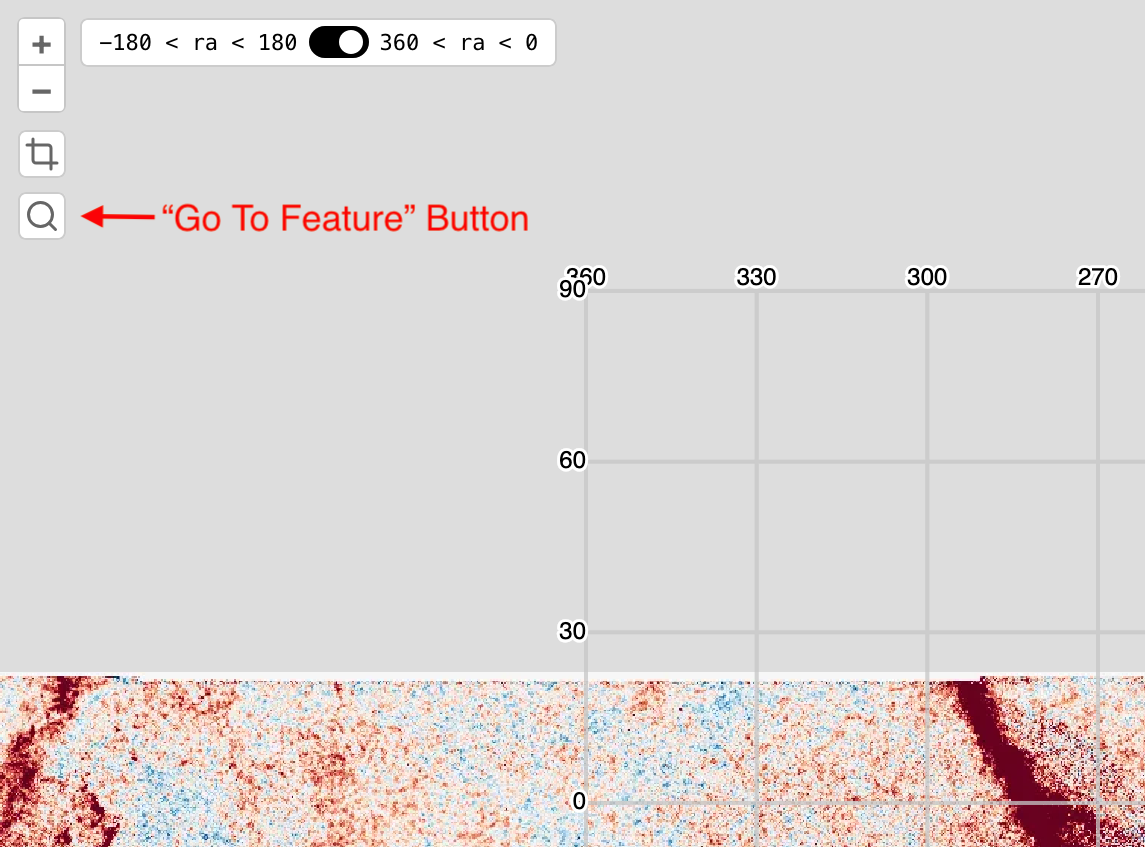
Enter a feature’s identifier and submit.
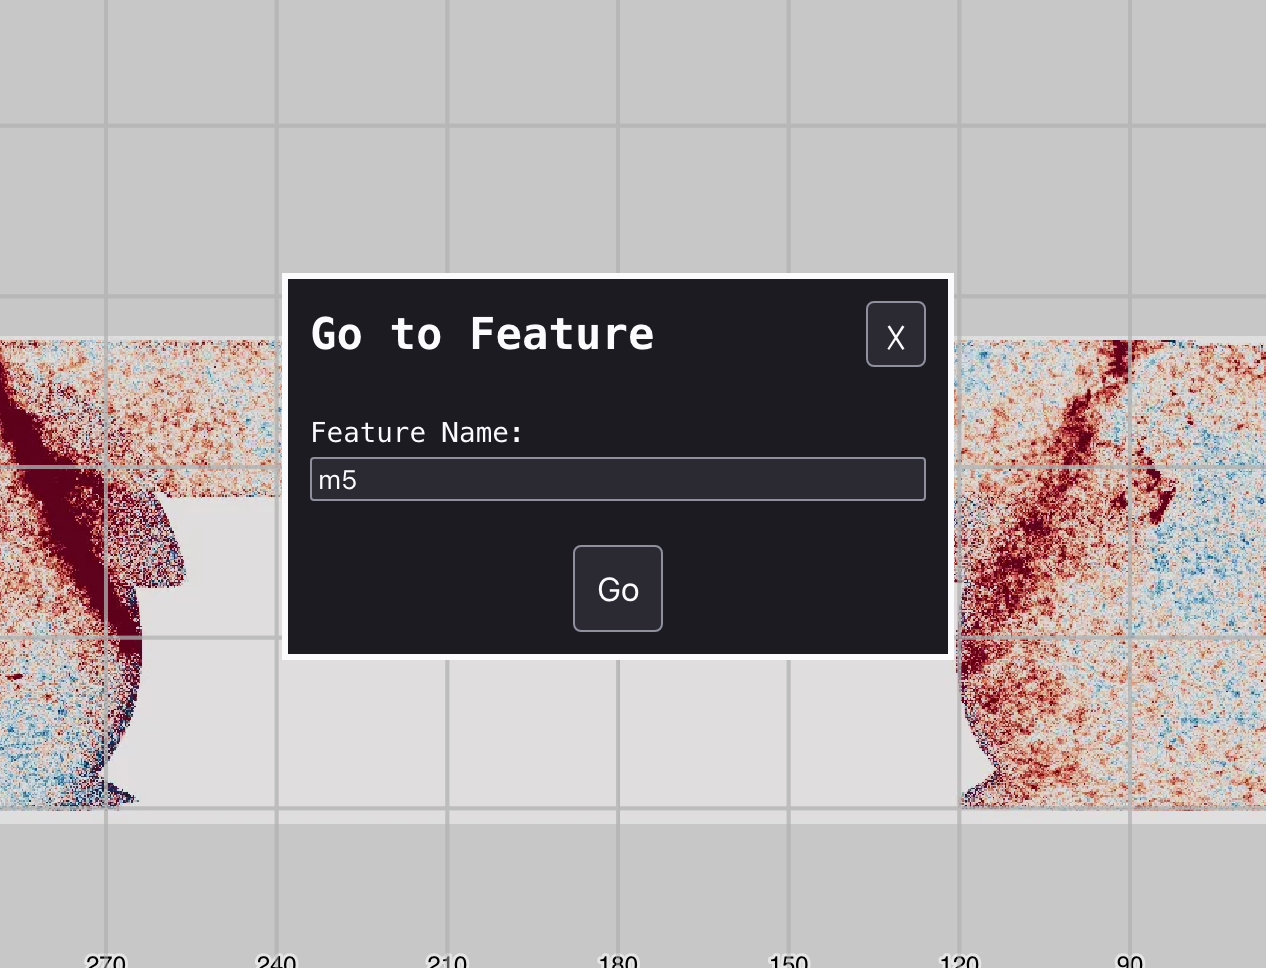
If the feature is found via a SIMBAD search, the map will center on a map marker with a popup at the feature’s position.
“Go To Position” Inputs
Click the RA or Dec coordinate shown at the bottom of the map.
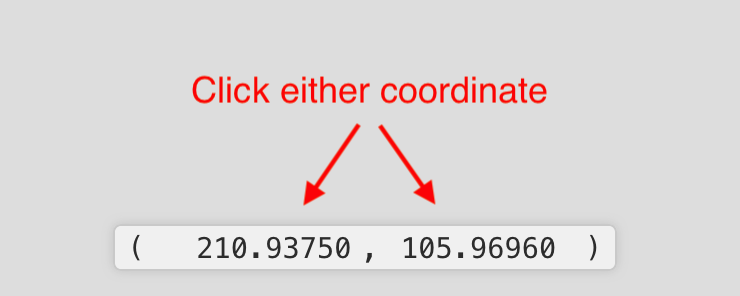
Enter the desired RA and Dec in the inputs that appear.

Press Enter and the map will center on a map marker with a popup at the position.
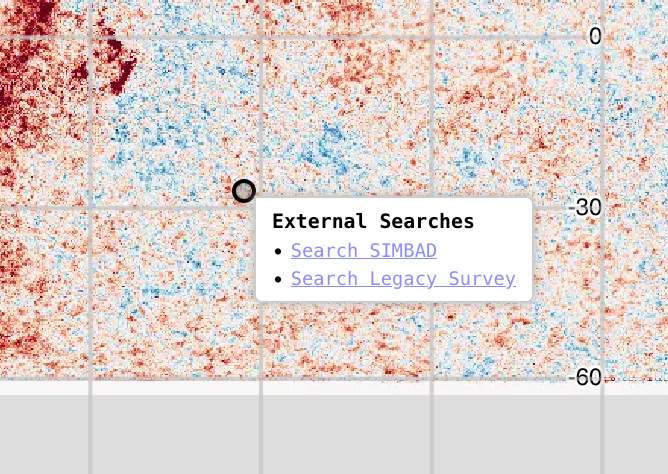
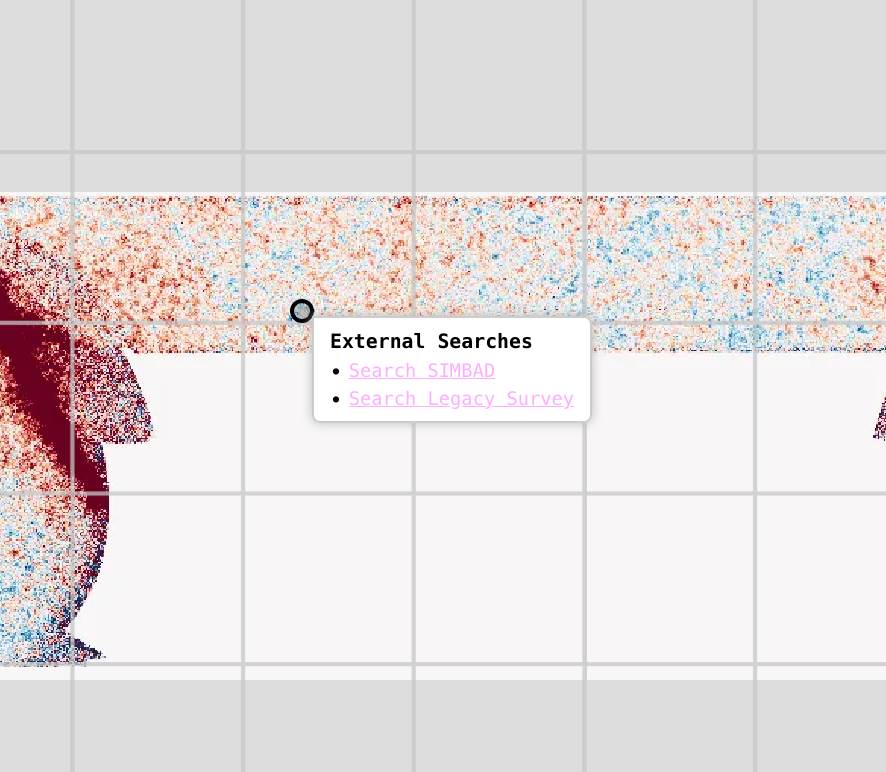
External Searches
Users can search SIMBAD or explore in Legacy Survey an area of interest. The SIMBAD search is performed with a radius of 5 arcmin from the clicked position. The Legacy Survey instance will open and be marked at the clicked position.
This feature can be surfaced as follows:
Hold the
Altbutton and click anywhere on the map. A marker with a popup will appear. The popup is identical to those shown in Step 3 of both “Go To” features described above.Click the desired search link(s). Note that links open in a new tab.
Download Cutouts
Regions of a map’s active baselayer, with the exception of any “comparison map” baselayers, can be downloaded as .fits, .png, .jpg, or webp files by doing the following:
Either toggle on the region in the layer menu or click the crop icon in the top left to draw a region of interest. The screenshot below shows the button for drawing a new highlight region. Refer to Highlight Regions above to learn how to use the layer menu to toggle on/off existing highlight regions.
Hover over the region of interest to show the region’s overlay information.

Click the hamburger menu button to show the download options, and select the desired file type.
Histogram Controls
Defined Parameters
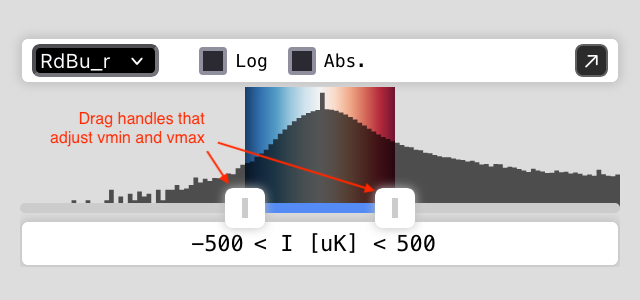
Some of the color map settings used in the histogram and baselayers are derived from matplotlib. The image below shows the histogram annotated with the matplotlib variable names of each field, followed by a brief description of each matplotlib parameter.
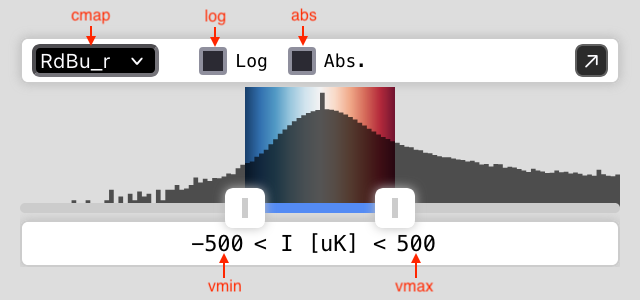
vminandvmaxThese set the data range that
matplotlibuses to map to the color map.
cmapThis corresponds to the selected color map, which defaults to
RdBu_r.
Additionally, the tile server responds to the following boolean values:
logDetermines whether or not a log transform is applied.
absDetermines whether or not an absolute value transform is applied. Note that the transform essentially folds negative values into positive values rather than filtering away negative values.
Changing Parameters
With the Dialog
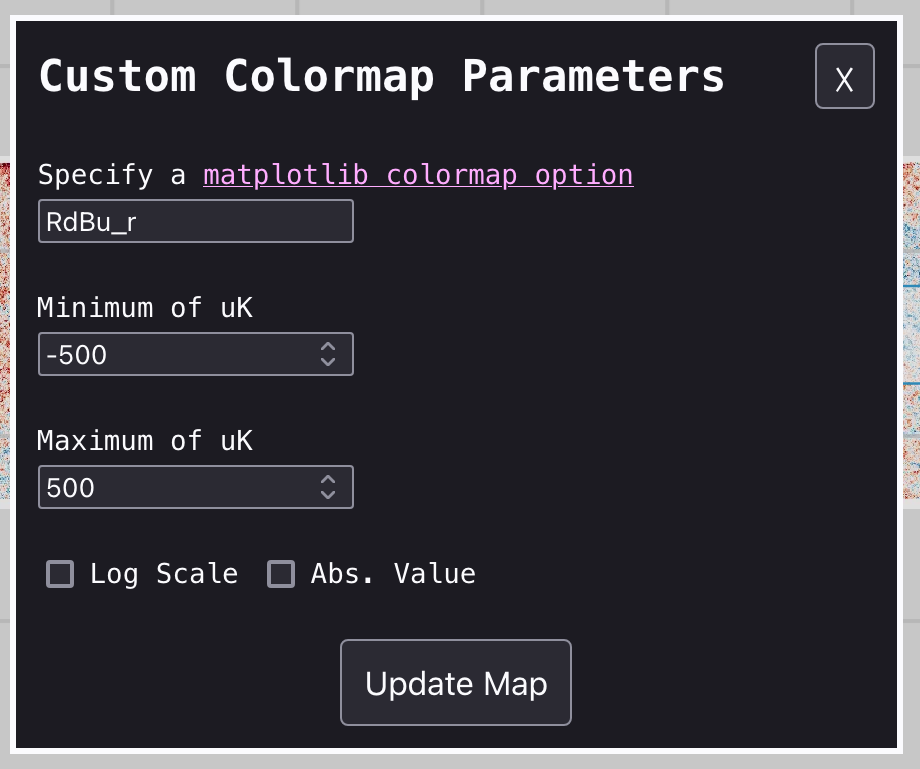
Click the button with the diagonal arrow to open a dialog box that allows more precise adjustments of each parameter.
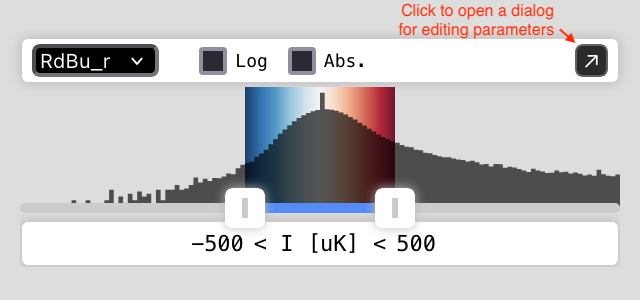
Edit the desired parameter(s), then submit.
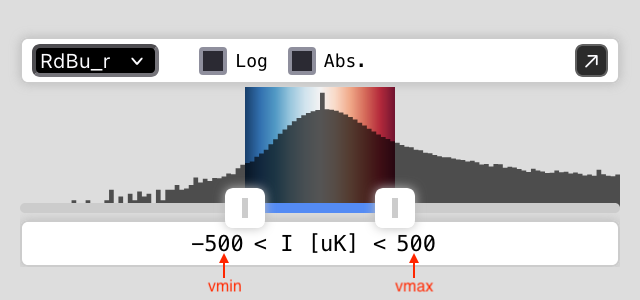
Changing vmin and vmax
There are a number of ways to change vmin and vmax, either individually, simultaneously, or precisely.
Individually
Use the slider’s drag handles to change vmin or vmax.
Simultaneously
Users have two options that change vmin and vmax simultaneously and maintain the difference between them.
Option 1: Drag the blue bar between the slider’s drag handlers left or right.
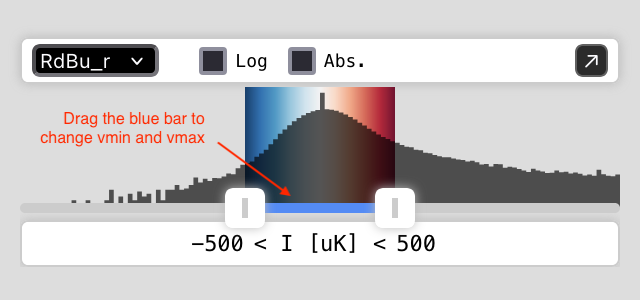
Option 2: Use
AandDas described in the keyboard shortcuts table.
Users can also use W and S to widen or narrow, respectively, the range between vmin and vmax. Again, refer to the keyboard shortcuts table.
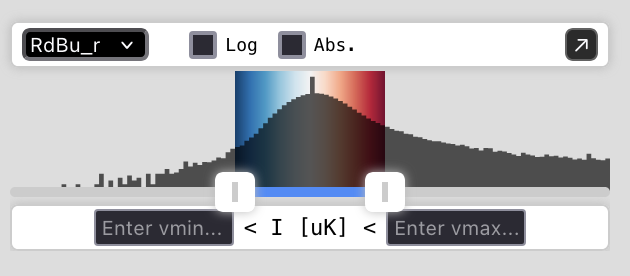
Precisely
Users can precisely set vmin and vmax as follows:
Click either the
vminorvmaxvalue shown in the histogram display.
Enter
vminandvmaxvalues into the inputs that appear. Press enter to set these values.
Alternatively, use the dialog box shown above to precisely set vmin and vmax.
Changing cmap
Users can use the dropdown selector to choose between one of the built-in options. If a different cmap value compatible with matplotlib is desired, use the dialog box and enter its value in the color map field.
Apertures
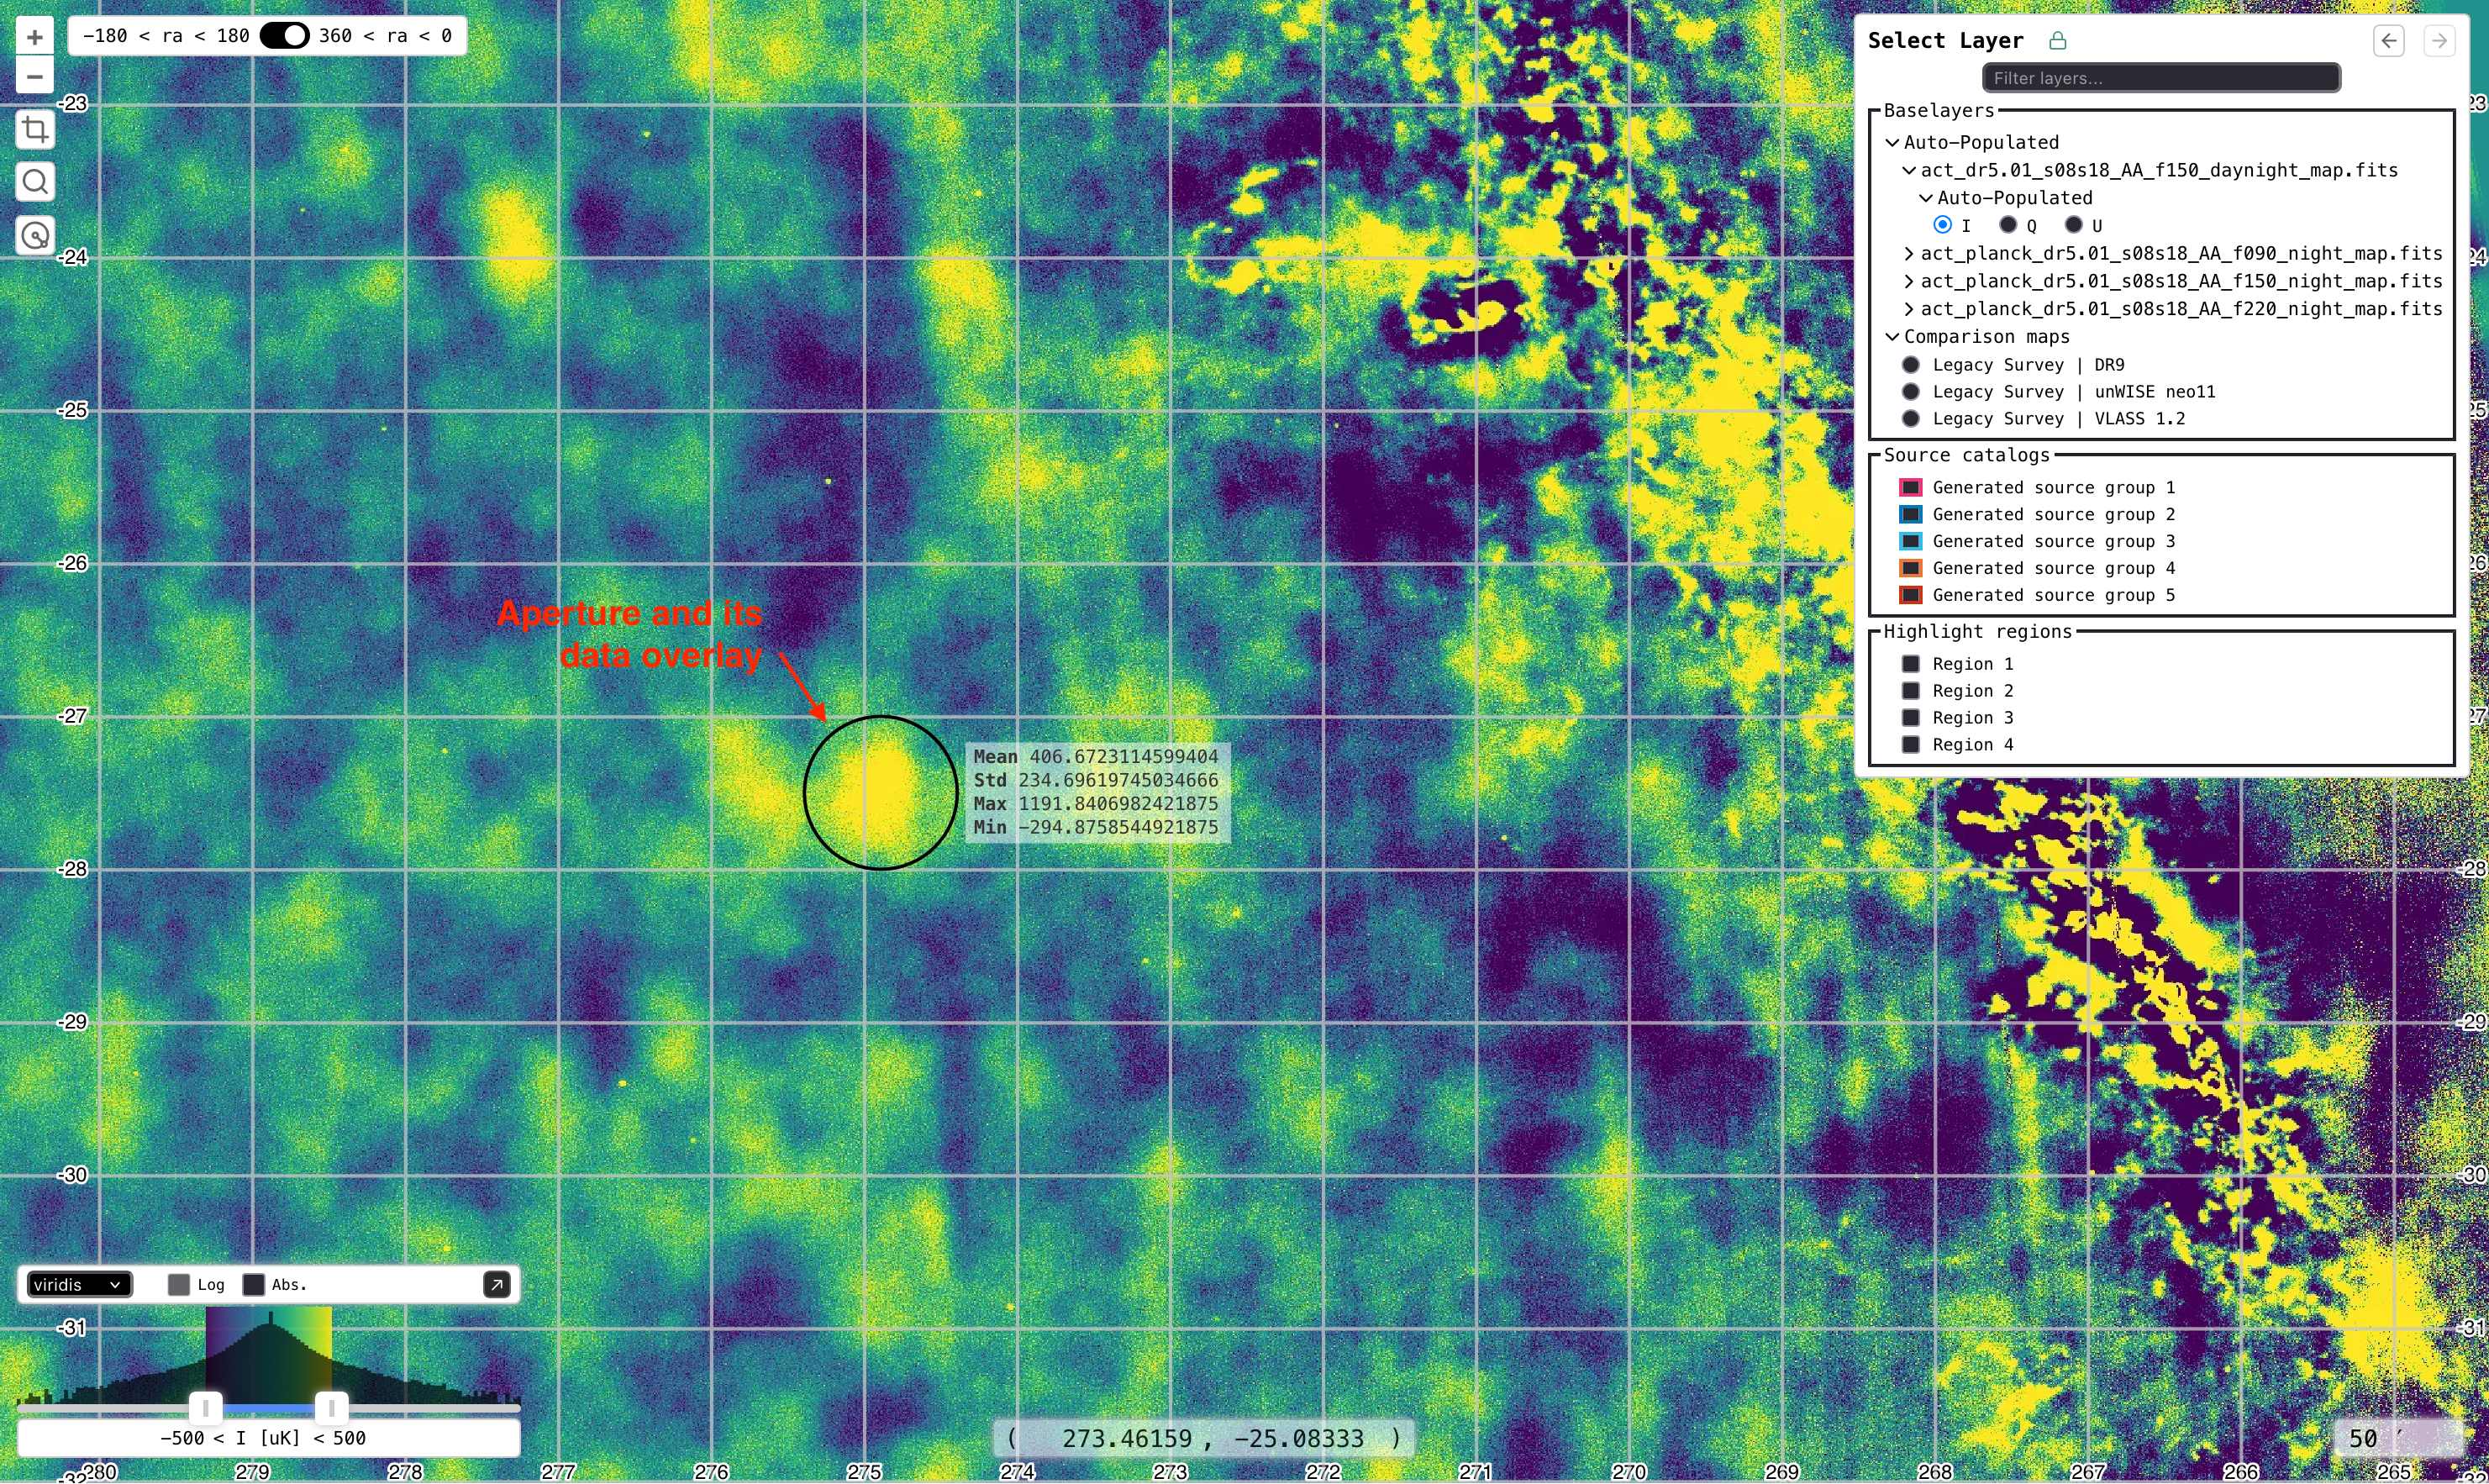
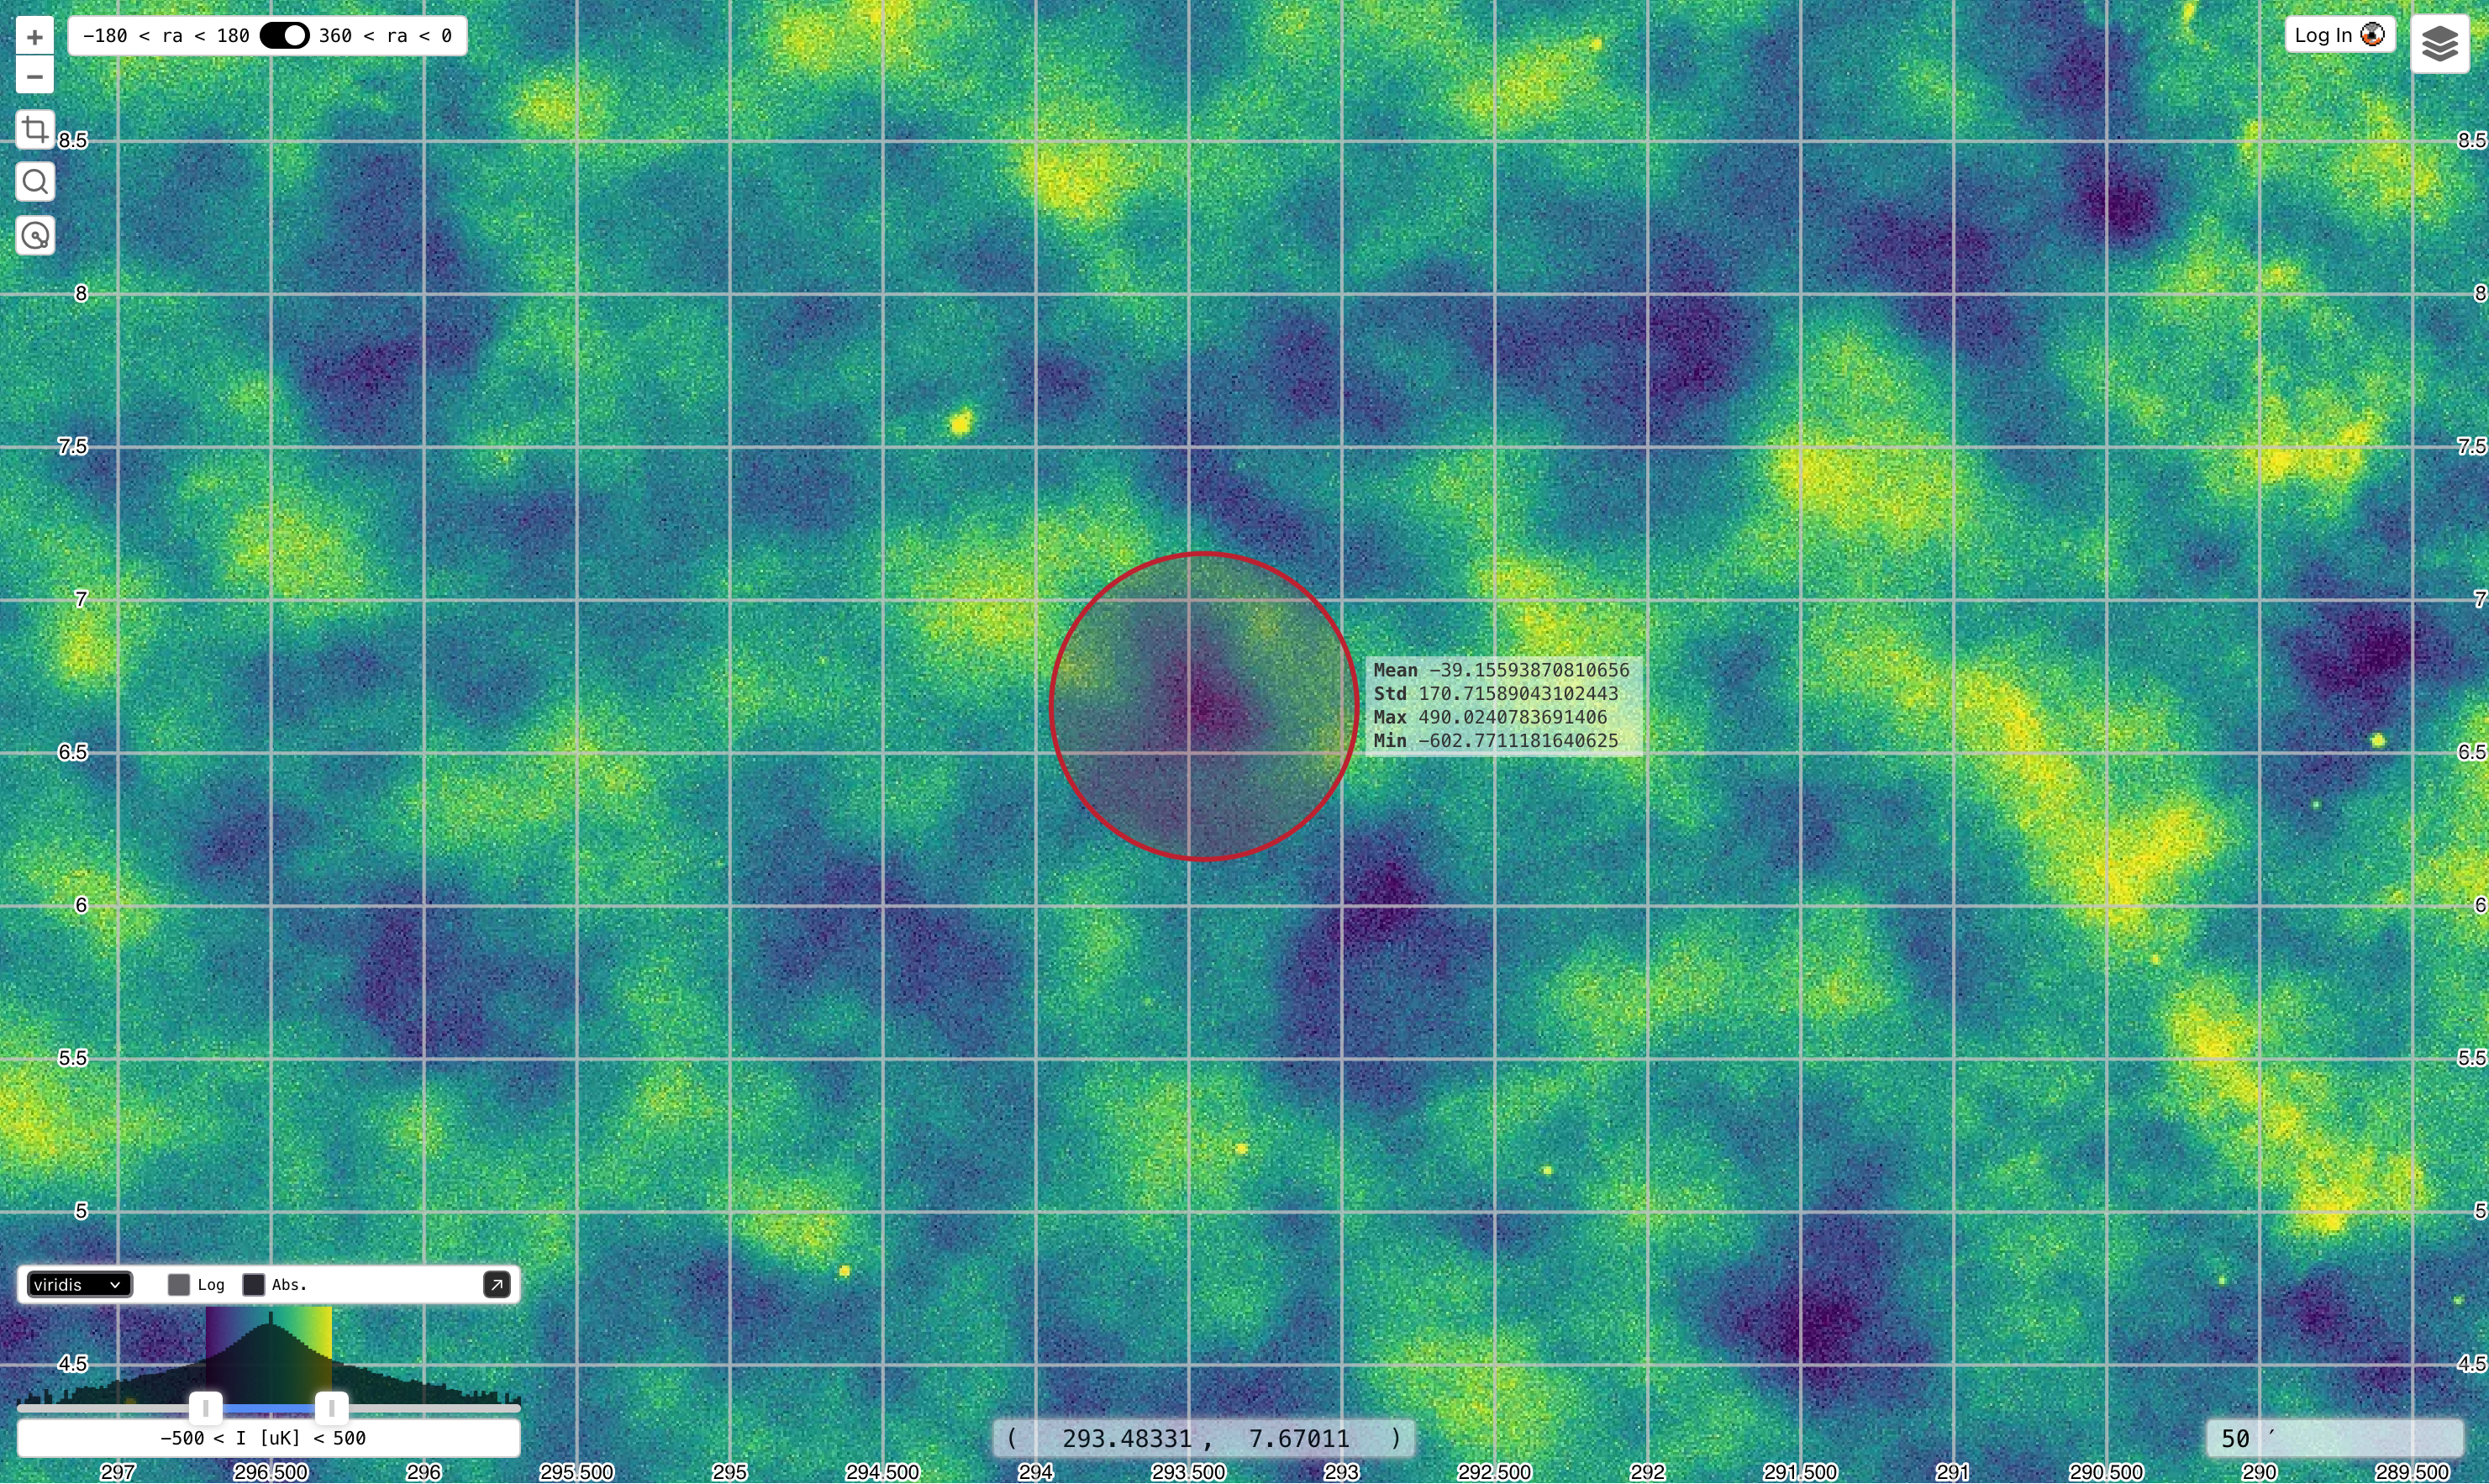
This feature allows a user to more deeply inspect a small region of a baselayer. Specifically, a user can draw a circle overlay with a maximum 1-degree diameter. A request then returns the mean, standard deviation, maximum, and minimum pixel values contained within the region.
The apertures will automatically update data when changing baselayers and users are limited to at most 3 apertures. Note, however, that this feature is disabled for external baselayers. When a user changes to an external baselayer, the button to add apertures will be disabled and any apertures shown on the map will be hidden.
Adding an Aperture
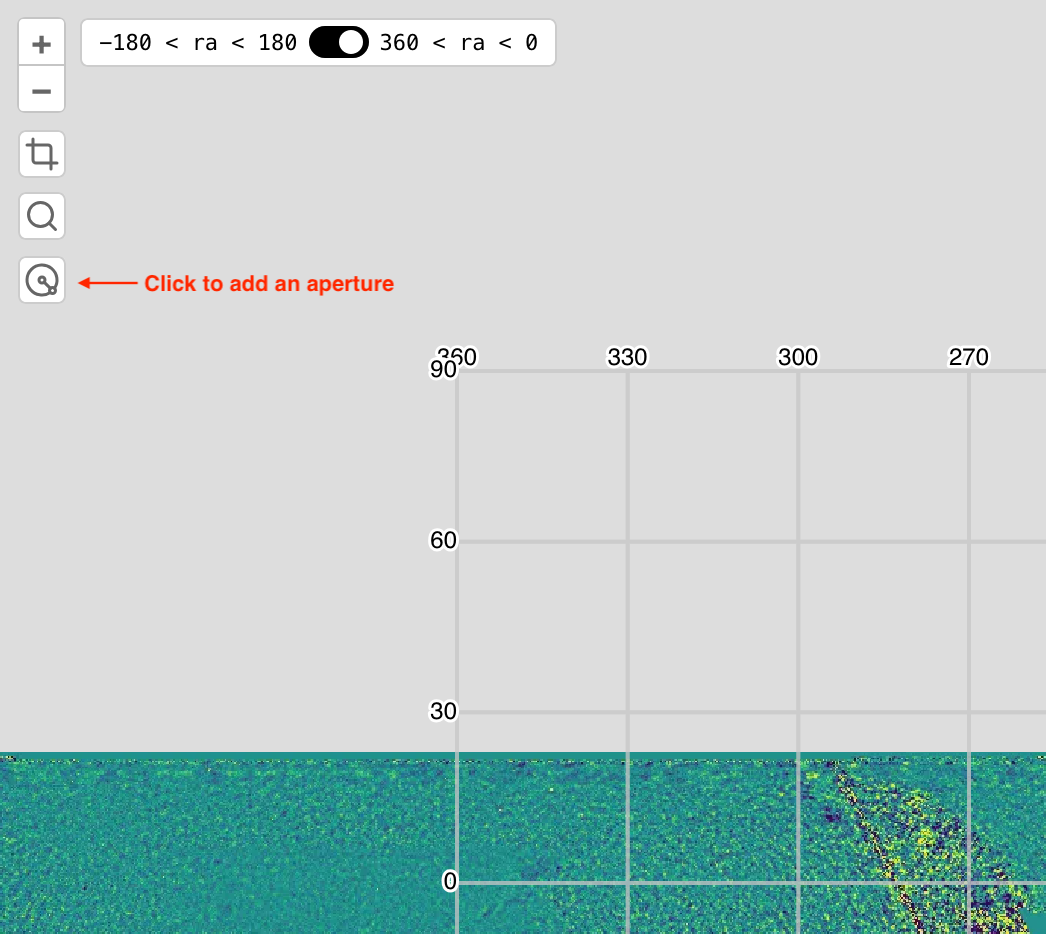
To draw an aperture, a user will:
Click on the button to enable the draw feature
Select a point on the map to be the center of the aperture
Use the mouse to adjust the diameter of the aperture, which is restricted to a maximum of 1 degree.
Click the map to finalize the aperture. This triggers the data retrieval that, once received, will be rendered.
Note that users are limited to 3 apertures. Once the limit is reached, the button to add apertures will be disabled.
Removing an Aperture
To remove an aperture, a user will:
Click the aperture or its data overlay in order to select an aperture for removal. Refer to the screenshot to note how the aperture will appear when selected.
Press
deleteon the keyboard to remove the aperture.